Here you see the list of files uploaded in the storage server for the selected client/group as shown in the figure:
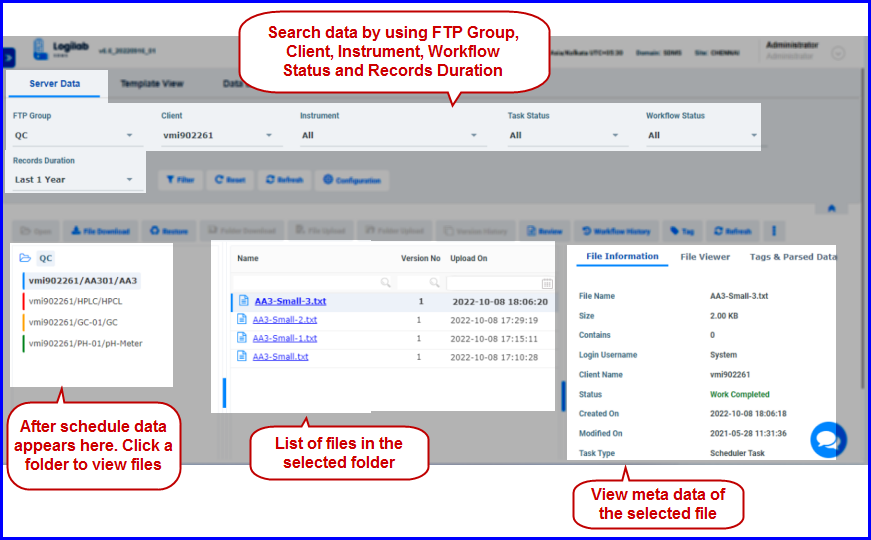
FIGURE:-Server Data Tab
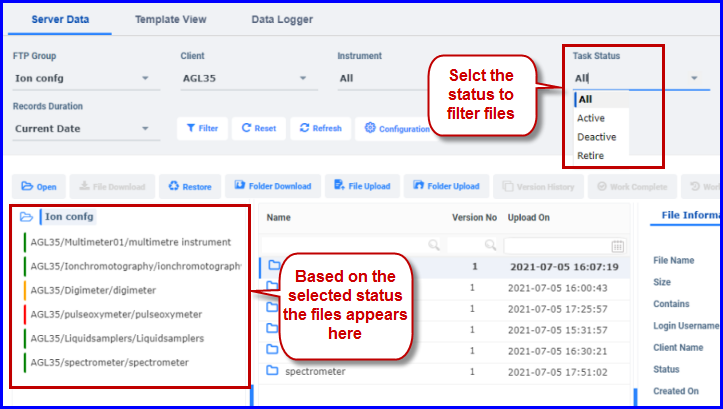
FIGURE:- Filter Files Based on Task Status
| Filters | Action Controls |
|---|---|
| Instrument | Open |
| Workflow Status | File Download |
| Restore | |
| Folder Download | |
| File Upload | |
| Folder Upload | |
| Workflow History | |
| Tag | |
| Audit Trail History | |
| Attribute |
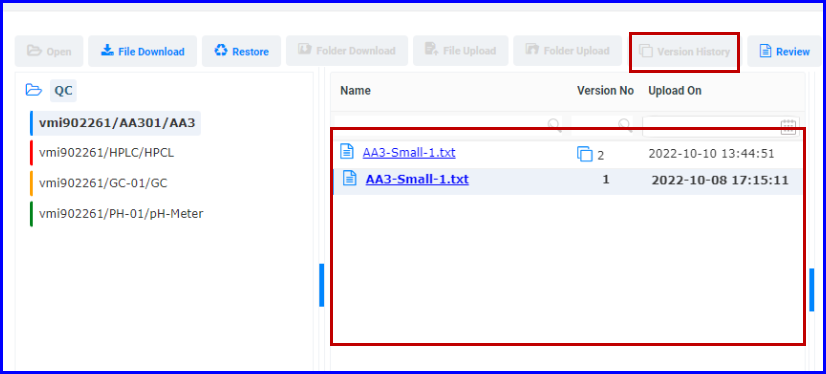
FIGURE:-Server Data Tab – Version History Option
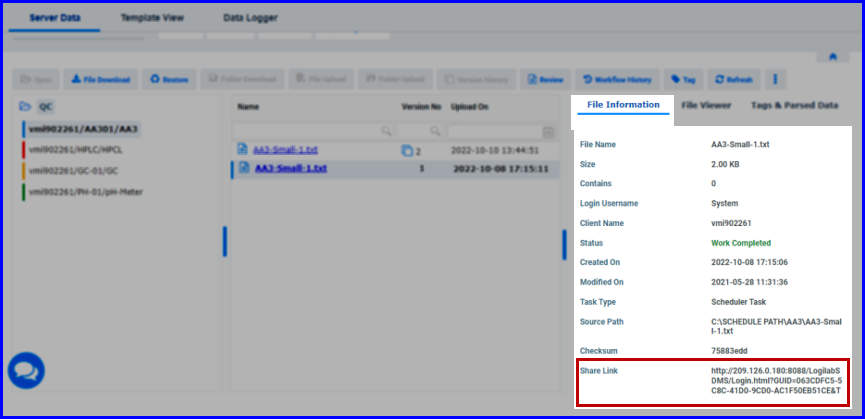
FIGURE:- Server Data Tab – Share link Option
File Download: Select a file and then click File Download. the selected file is downloaded to the local storage as a zip file as shown in the figure:
Open the zip file. You can see the file downloaded along with the Audit trail history and version history as shown in the figure: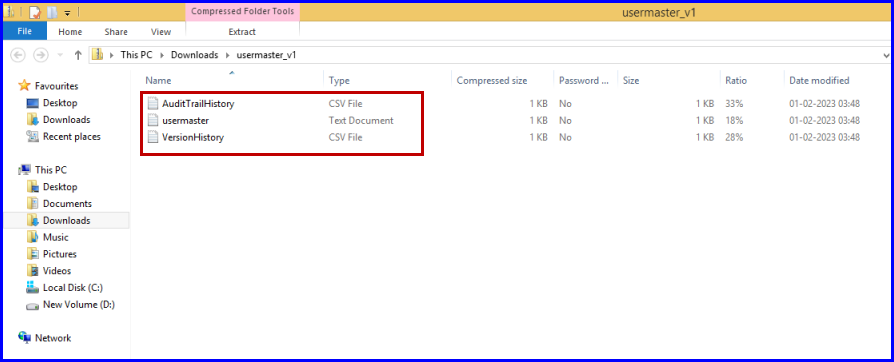
FIGURE:- Server Data Tab - File Downloaded with Audit Trail History and Version History
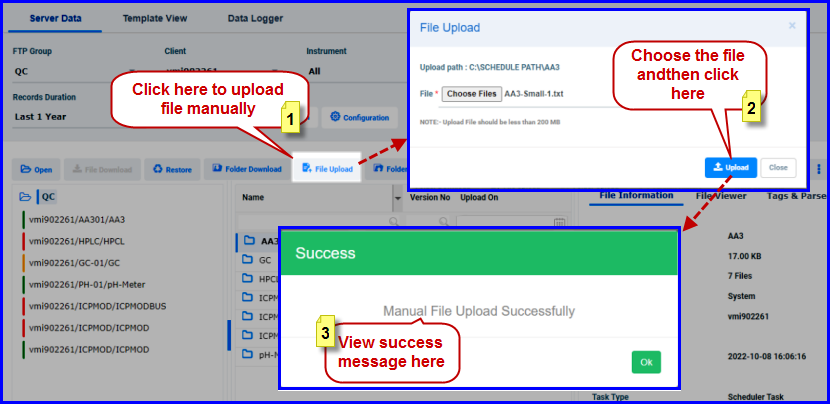
FIGURE:- Server Data Tab - File Upload Option
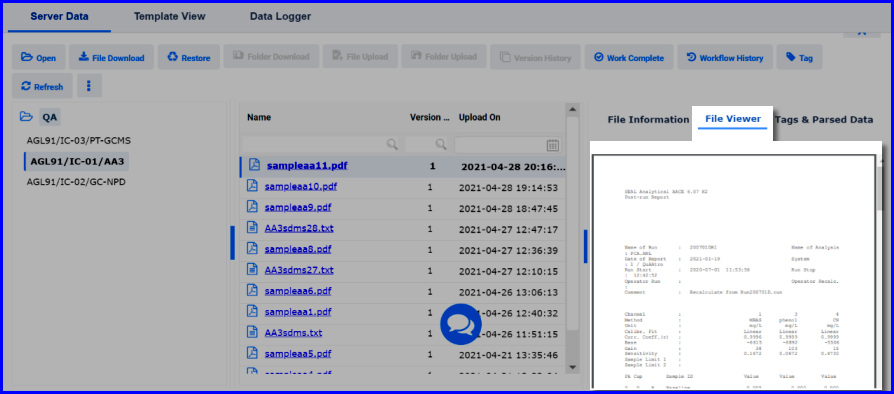
FIGURE:– File Viewer Tab
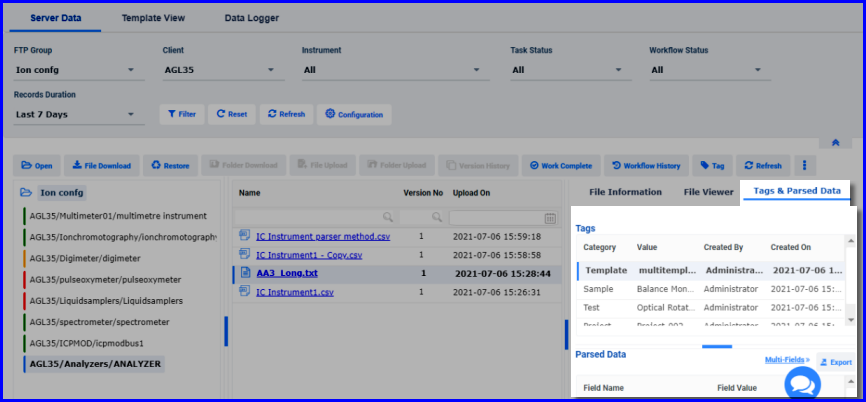
FIGURE:- Tags & Parsed Data Tab
1.If multiple fields are parsed then you can click Multi-Fields to view parsed fields. The Multi-Fields dialog appears as shown in the figure:
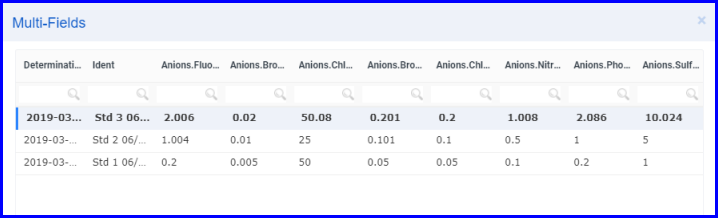
FIGURE – Multi Fields Dialog
2.Click Export to Export parsed fields to Excel sheet
The Search Server Data tab enables you to search records based on File, Tag and Parameter. You can search based on the selected field(s), records duration and by selecting the relational operator.
1.On the main menu, click,  FTP Data View, and then click Search Server Data. The Search Server Data tab appears as shown in the figure:
6.Click Save..
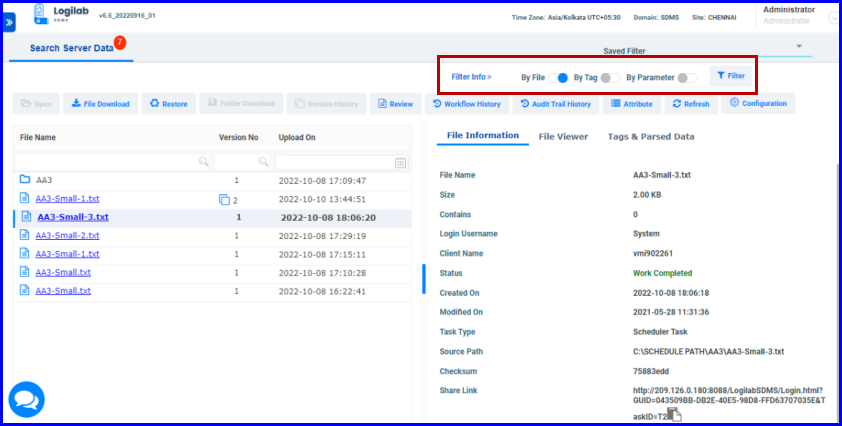
FIGURE:- Search Server Data Tab
1.Click to select the By File option as shown in the above figure and then click Filter. The By File filter screen appears as shown in the figure:
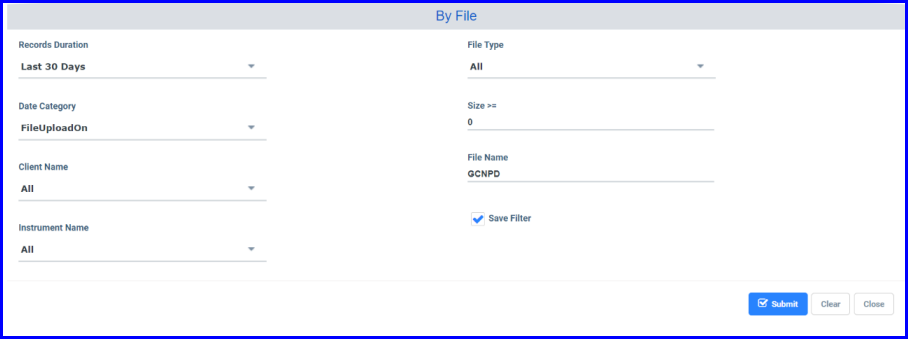
FIGURE: 13k - By File Filter Screen
2.In the By File filter screen, fill in the following fields appropriately. You can fill in fields whichever is required.
3.In the Records Duration field, select duration to fetch records.
4.In the Date Category field, select the date category to fetch records.
5.In the Client Name field, select the client..
6.In the Instrument Name field, select the instrument.
7.In the File Type field, select file type.
8.in the Size > =, field, select the operator. For example, >, </,=
9.In the File Name field, type the file name to fetch records
10.Click to check the Save Filter check box to save the filter
11.Click Submit.
1.In the Search Server Data screen, click to select the By Tag option as shown in the above figure and then click Filter. The By Tag filter screen appears as shown in the figure:
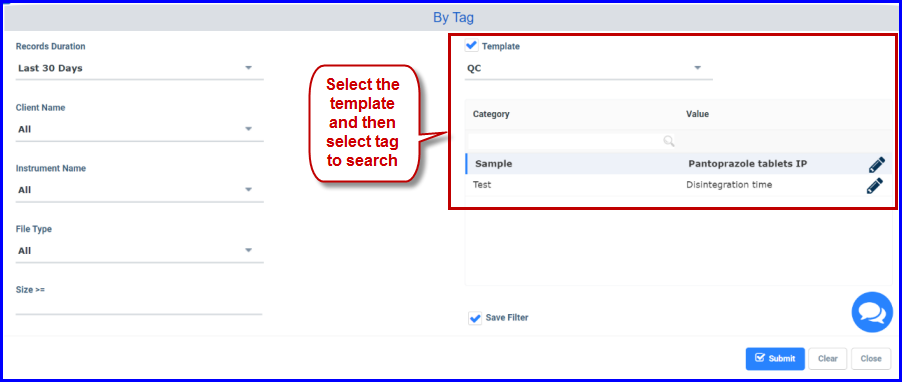
FIGURE:- By Tag Filter Screen
2.In the By Tag filter screen, fill in the following fields appropriately. You can fill in fields whichever is required.
3.In the Records Duration field, select duration to fetch records.
4.In the Client Name field, select the client.
5.In the Instrument Name field, select the instrument.
6.In the File Type field, select file type.
7...Click to check the Template check box to select a template. And then select the template from the list. Tags that are available in the selected template appears below as shown in the above figure. Select the tag
Click to check the Save Filter check box to save the filter.
9.Click Submit. Records matching the selected tag and other search criteria are fetched and appears as shown in the figure:
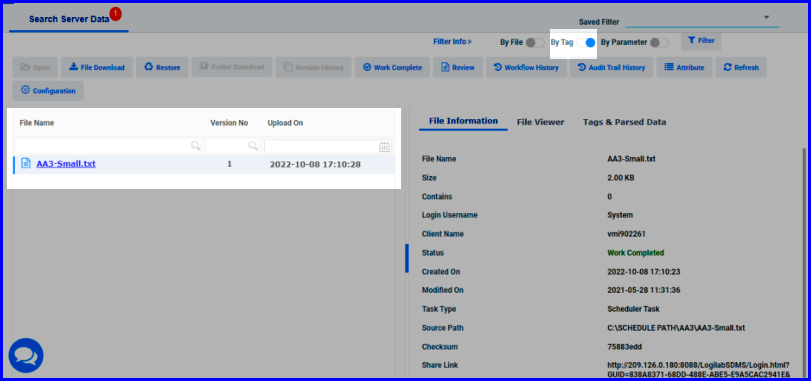
FIGURE – Server Data Fetched - By Tag Filtern
1.In the Search Server Data screen, click to select the By Parameter option and then click Filter. The By Parameter filter screen appears as shown in the figure:
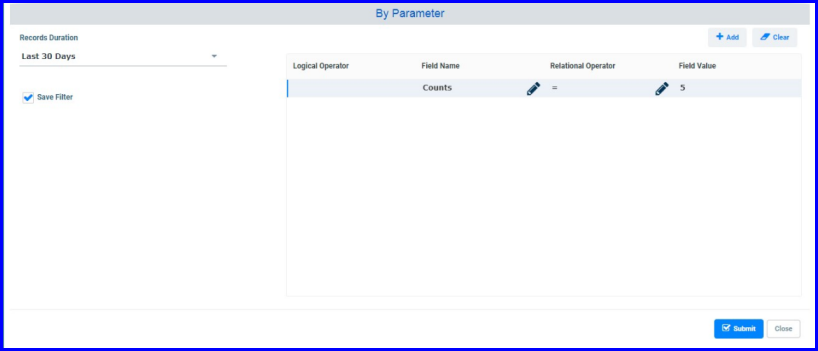
FIGURE:- By Parameter Filter Screen
2.In the By Parameter screen, in the Records Duration field, select duration to fetch records.
3.In the Field Name field, click  and then select the field to search. Click
  to add more fields to the filter.
4.In the Relational Operator field, click and then select the operator. For example, = >, <,etc.
5.In the Field Value field, type the value.
Click to check the Save Filter check box to save the filter setting.
Click Submit. The Save Filter dialog appears as shown in the figure
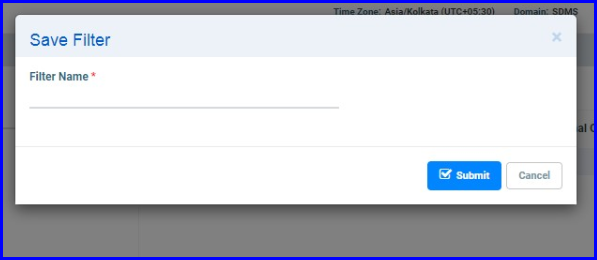
FIGURE: – Save Filter Dialog
8.In the Filter Name field, type a name for the filter you want to save and then click Submit. The chart view of the filtered server data appears as shown in the figure:
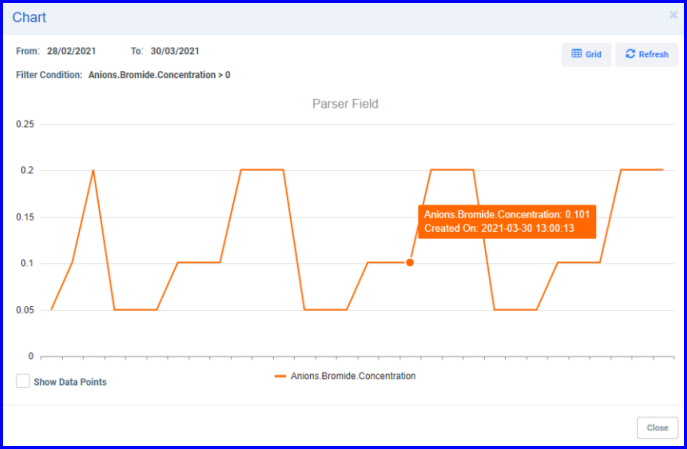
FIGURE:– Multi Fields Chart View
9.Click.  The grid view of the filtered server data appears as shown in the figure:
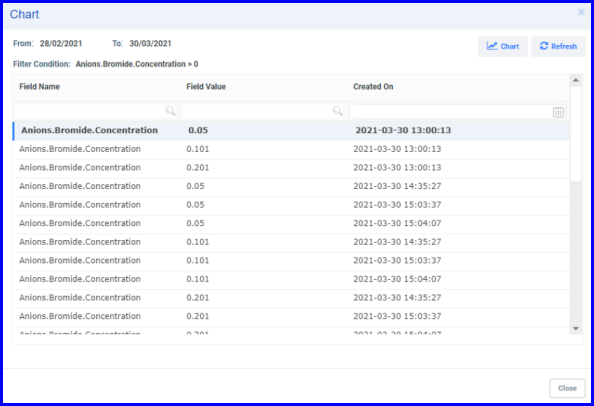
FIGURE:– Multi Fields Grid View
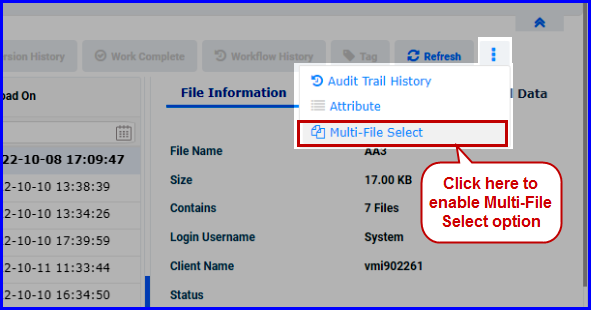
FIGURE:- Multi-File Select
The Workflow Status screen appears as shown in the figure:
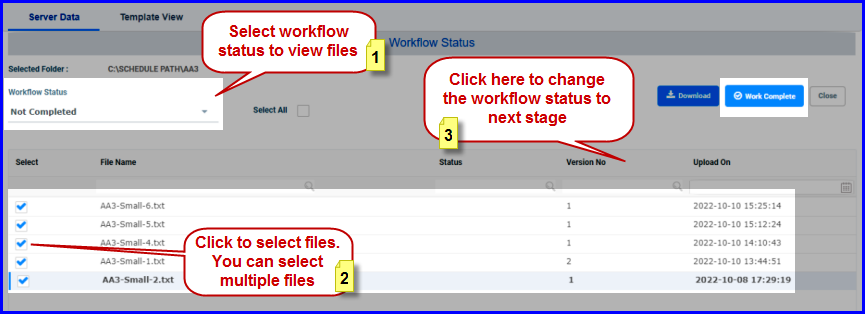
FIGURE:– Updating Status of Multiple Files
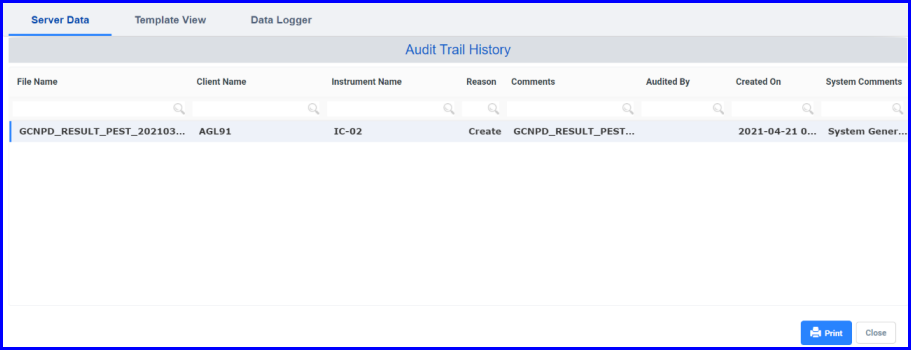
FIGURE: 13t - Audit Trail History
Attribute: Enables view attributes of the selected record/document as shown in the figure:
When a file is received from an instrument, the file is filtered and captured based on the template parameters set in the Instrument lock screen. And the files are listed with the tag values as shown in the figure
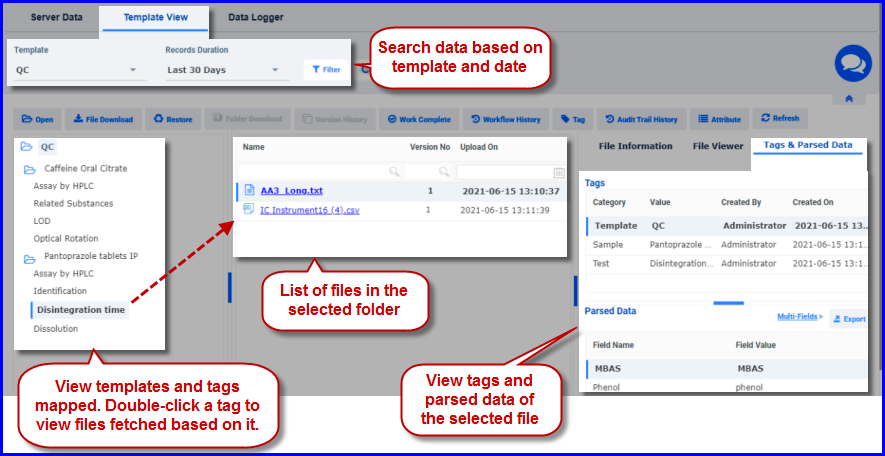
FIGURE:Template View Tab
You can also double-click the file from the list to open to view the contents as shown above.
Instrument Lock helps in linking metadata from the template tags. Before capturing data from an instrument, user can lock the instrument with specific combination of tags. These tags are automatically linked to the next data capture from instrument. The Template Data tab helps in viewing the server data based on the templates. This gives a more meaningful view for the data captured from instruments. For example: A quality control analyst will be interested in viewing data based on product> test>batch#. To know more about instrument lock, refer Instrument Lock and Tags
The Data Logger tab enables filter and view captured file log based on the FTP Group, Client, Instrument and specified date range. You can filter file log based on the Data Type: Alarm / Reading / Both and Channel: A1/ B1/A2/B2/All. The Data Logger tab appears as shown in the figure:
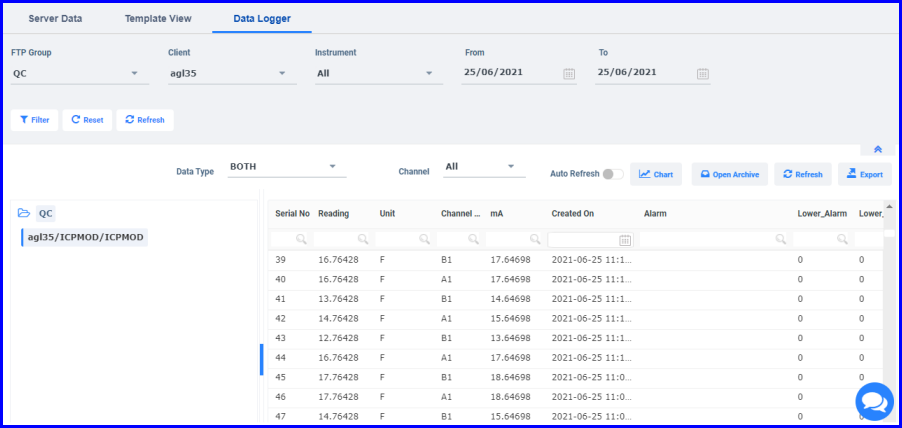
FIGURE:- Data Logger Tab Showing Log in Grid
Note: Data Logger feature is applicable only for interfacer mapped instruments.If the Data Logger checkbox in the Scheduler screen is checked, then for every capture from the instrument, log is created and stored in the specified path. Auto Refresh: If you enable the Auto Refresh option, the log screen is refreshed with new entry for every capture from the instrument.
By default, the Data Logger screen appears in the grid. You can click to view log in the chart form for all data types: Alarm / Reading / Both and for the selected channel as shown in the figure:
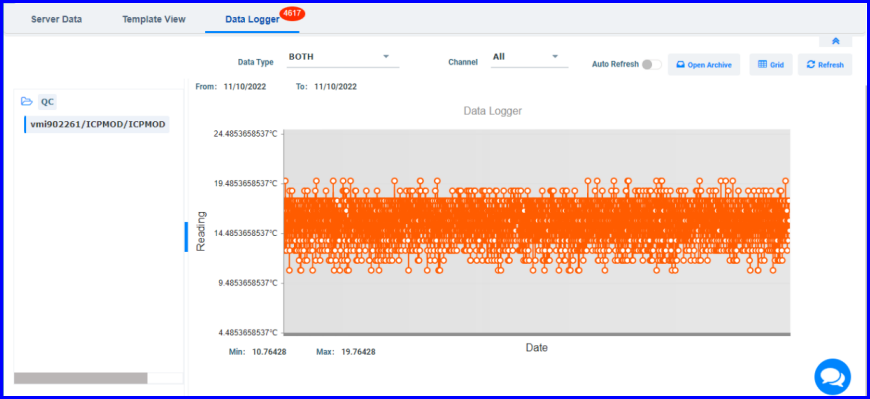
FIGURE:- Data Logger Tab Showing Log in Chart for the Selected Data Type and Channel
Data log can be archived if the same is mentioned in the scheduler. Click  to view the log in the archive. The Open Archive screen appears as shown in the figure:
To view the archive in the chart click  . The chart view appears as shown in the figure:
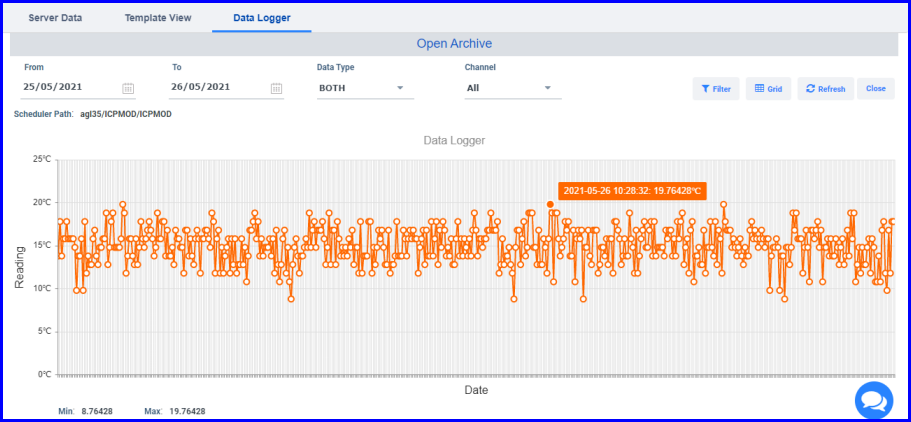
FIGURE:- Data Logger Tab Showing Log in the archive – Chart View